174 lines
7.5 KiB
Markdown
174 lines
7.5 KiB
Markdown
node-red-node-ui-table
|
|
======================
|
|
|
|
A Node-RED UI widget node which displays data as a table.
|
|
|
|
## Install
|
|
|
|
Either use the Editor - Menu - Manage Palette - Install option, or run the following command in your Node-RED user directory (typically `~/.node-red`) after installing Node-RED-dashboard.
|
|
|
|
npm i node-red-node-ui-table
|
|
|
|
## Usage
|
|
|
|
This table node expects `msg.payload` to contain an array of data, one object per row.
|
|
Each data row object should have the same set of keys because the keys in the object are used as the column names.
|
|
|
|
Both examples can be imported from the Node-RED Editor - Menu - Import - Examples
|
|
|
|
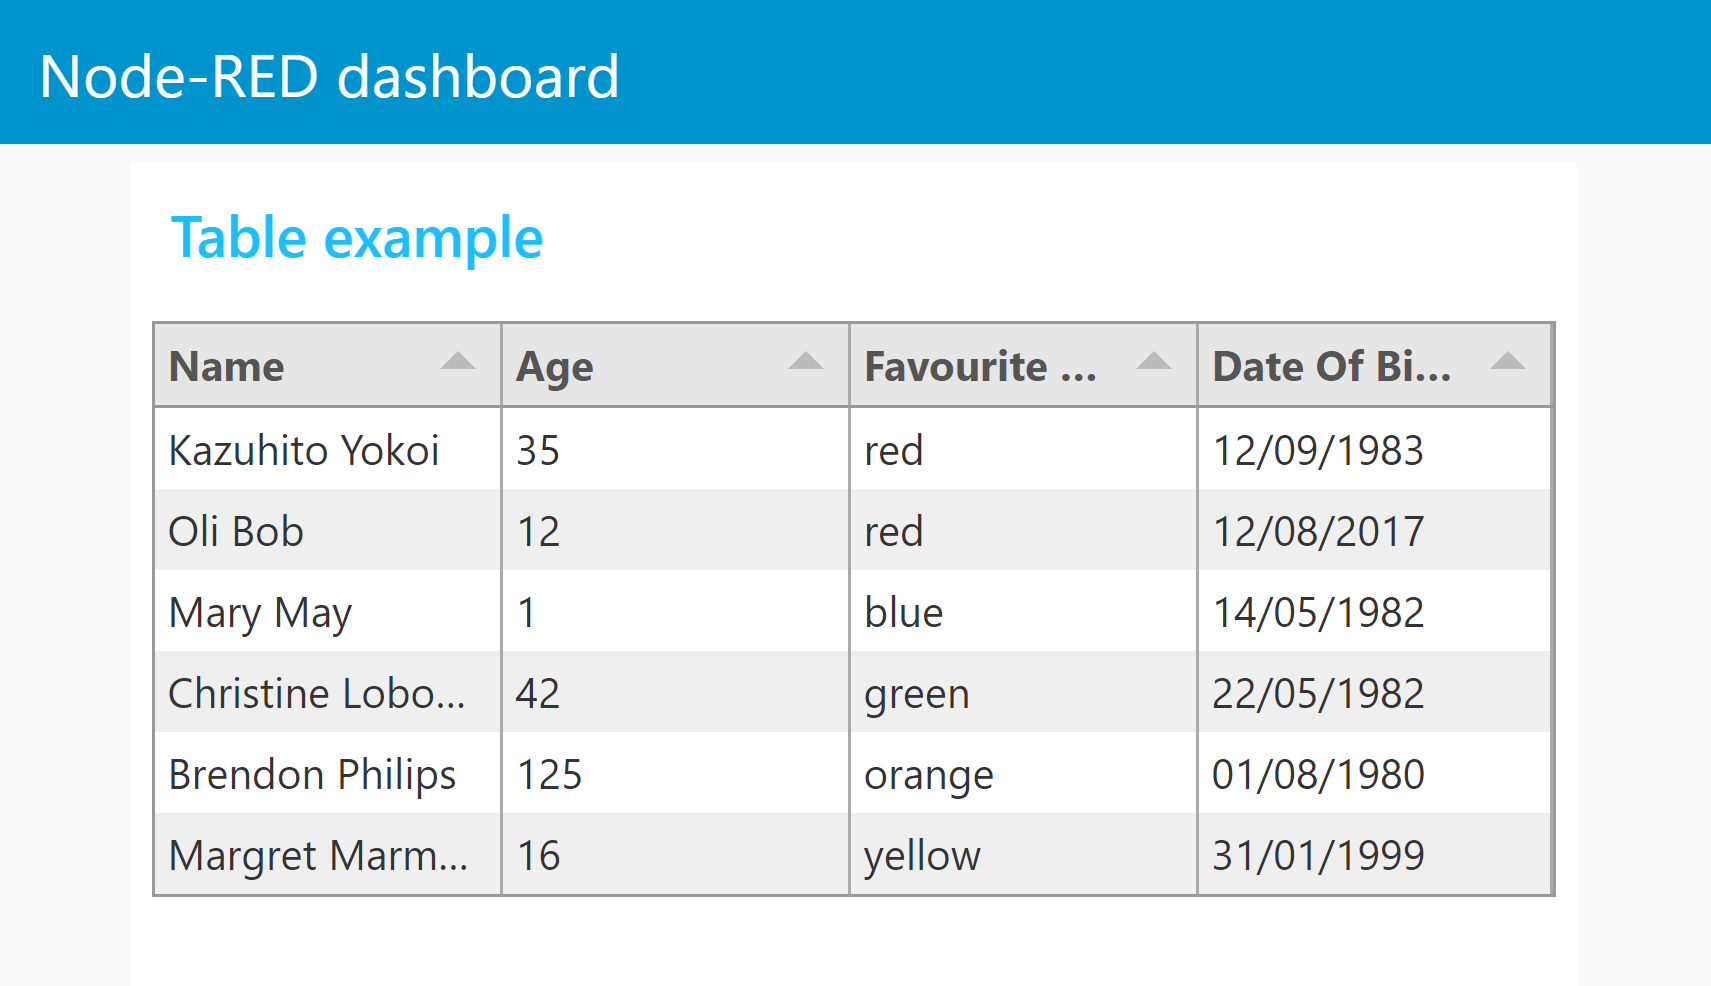
### Simple Table
|
|
|
|
With no configuration the node will try to create a table with equally spaced columns of simple text for each row provided, using the keys as column titles.
|
|
|
|
|
|
|
|
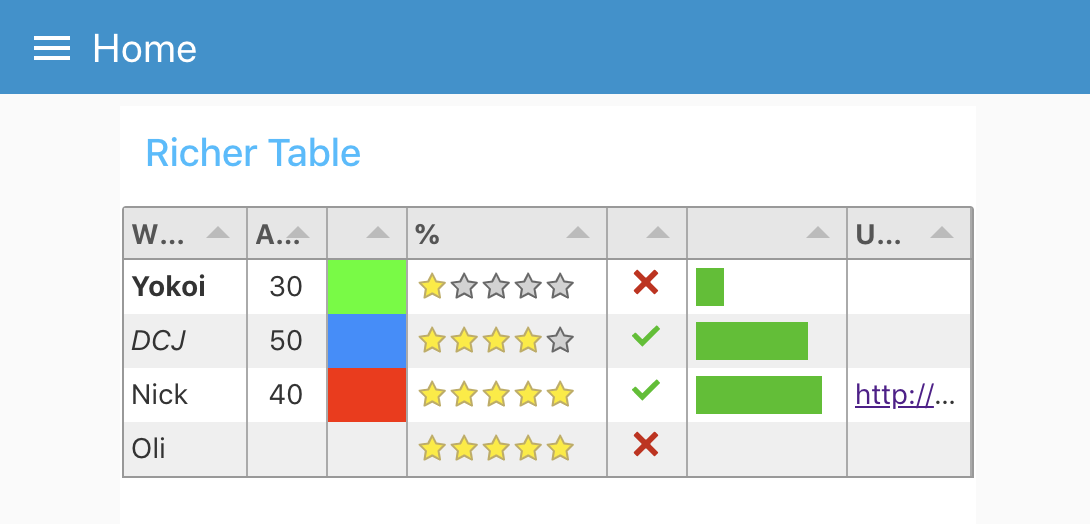
### Richer Table
|
|
|
|
The columns can be configured manually. If so then only the `msg.payload` properties defined will be displayed. You can then also define the Title, Width, Alignment and Format of the column.
|
|
|
|
|
|
|
|
- **Title**: Text for the column title (or blank).
|
|
- **Width**: Either a number of pixels or percentage of the overall table width. e.g. 150 or 20%. Leave blank for automatic, equally spaced to fill the available space.
|
|
- **Align**: Column alignment, left, centre or right.
|
|
- **Format**: Formatting of the input.
|
|
- **Plain Text** - Simple text values.
|
|
- **HTML** - Rich html to allow text Formatting - *NOTE*: this is raw un-sanitised HTML.
|
|
- **Link** - URL link to a web page.
|
|
- **Image** - Source (src) URL of an image to display.
|
|
- **Progress** - a progress bar from 0 to 100.
|
|
- **Traffic** - Red/Amber/Green indicator light set by numbers in the range 0-33-67-100.
|
|
- **Color** - HTML color name, or hex value (#rrggbb) to fill the cell.
|
|
- **Tick/Cross** - Tick or Cross symbol, boolean true/false, numeric 1/0 or text "1"/"0".
|
|
- **Stars** - Number of stars - numeric 0 to 5.
|
|
- **Row Number** - Current row number.
|
|
|
|
|
|
### Example data
|
|
|
|
```
|
|
[
|
|
{
|
|
"Name": "Kazuhito Yokoi",
|
|
"Age": "35",
|
|
"Favourite Color": "red",
|
|
"Date Of Birth": "12/09/1983"
|
|
},
|
|
{
|
|
"Name": "Oli Bob",
|
|
"Age": "12",
|
|
"Favourite Color": "cyan",
|
|
"Date Of Birth": "12/08/2017"
|
|
}
|
|
]
|
|
```
|
|
## advanced features
|
|
|
|
ui-table is based on the **tabulator** module. You can find an excellent in depth [documentation here](http://tabulator.info/docs/4.4) with many [examples here](http://tabulator.info/examples/4.4).
|
|
|
|
## send commands to ui-table
|
|
|
|
Instead of sending an array to ui-table this node to replace the complete table data ui-table also accepts an object as payload to send commands. Beside data manipulation you can [set filters](http://tabulator.info/docs/4.5/filter#func) and do many other things with commands. The object must have the following properties
|
|
|
|
- `command` a valid tabulator function such as `addRow`, `replaceData` or `addFilter`
|
|
- `arguments` *(optional)* array of arguments for that function
|
|
- `returnPromise` *(optional)* a boolean value. `true` if the function should return a promise message. See tabulator documentation which commands will return promises
|
|
|
|
example
|
|
```json
|
|
{"payload":{
|
|
"command":"addData",
|
|
"arguments":[
|
|
{
|
|
"facility":"daemon",
|
|
"facilityCode":3,
|
|
"severity":"info",
|
|
"severityCode":6,
|
|
"tag":"systemd[1]",
|
|
"timestamp":"2020-01-02T19:17:39.793Z",
|
|
"hostname":"localhost",
|
|
"address":"127.0.0.1",
|
|
"family":"IPv4",
|
|
"port":38514,
|
|
"size":80,
|
|
"msg":"some demo data",
|
|
"id":2351
|
|
},
|
|
true
|
|
],
|
|
"returnPromise":true
|
|
}
|
|
}
|
|
```
|
|
By sending only changed or new data to ui-table it is possible to update the table very fast by only sending the new data down to cell level. Or huge amounts of data could be sent like logs.
|
|
|
|
**important notices**
|
|
|
|
Data which is sent to ui-table through commands is **not** cached by ui-table! The flow has to take care to update the table for new clients connection or dashboard tab changes!
|
|
Tabulator does not limit the amount of data it holds. It is quite efficient in showing tables with a couple of thousand rows. If it the data exceeds the capabilities of the clients browser it will crash with an **out of memory** error without notice.
|
|
|
|
Example flow "4 sending commands.json" file can be found in the examples folder or installed directly using **menu/import/examples/ui-table**.
|
|
This flow shows a basic implementation how the flow can keep a cached copy of all table data and add/delete or update selective rows.
|
|
Most nodes have info text available in the info/help tab.
|
|
|
|
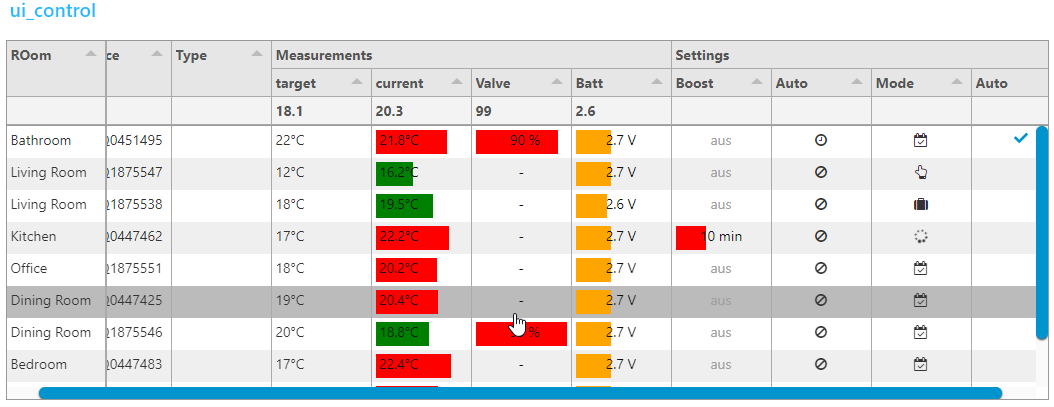
## control ui-table by sending ```msg.ui_control``` messages
|
|
|
|
ui-table can be customized by sending configuration data to `msg.ui_control.tabulator`.
|
|
|
|
|
|
|
|
by adding ***headers***, ***footers***, ***line*** or ***column grouping*** it is sometimes not possible to determine the amount of lines. Therefore the height can be defined by sending `msg.ui_control.customHeight=lines`.
|
|
|
|
Example flow "3 ui_control table.json" file can be found in the examples folder
|
|
|
|
- grouped columns by nesting column definition in ` ui_control.tabulator.columns`
|
|
- first column ```frozen``` from horizontal scrolling
|
|
- `formatterParams` to define min/max, color, legend or other parameters for `progress` and `planText` formatters
|
|
- functions to format legend values
|
|
``` javascript
|
|
// add a unit
|
|
function(cell, formatterParams, onRendered){
|
|
return cell.getValue()+"°C";
|
|
}
|
|
```
|
|
or more sophisticated using html
|
|
``` javascript
|
|
// convert Number to Icons
|
|
function(cell, formatterParams, onRendered){
|
|
var html="<i class=\"";
|
|
switch(cell.getValue()) {
|
|
case 0: html+="fa fa-calendar-check-o"; break;
|
|
case 1: html+="fa fa-hand-o-up"; break;
|
|
case 2: html+="fa fa-suitcase"; break;
|
|
case 3: html+="fa fa-spinner fa-spin fa-fw"; break;
|
|
}
|
|
html+='\"></i>';
|
|
return html;
|
|
}
|
|
```
|
|
- `topCalc` for average and min/max calculations
|
|
- custom icons for `tickCross` formatter
|
|
- `tick` formatter
|
|
- `groupBy` parameter to use group lines. `groupHeader` function to format legend and adding html tags (Insert a field name in the groupBy paramter at the end of json in the change node to use this feature)
|
|
- `columnResized` callback function to receive a message when the user resize a column
|
|
``` javascript
|
|
function(column){
|
|
var newColumn = {
|
|
field: column._column.field,
|
|
visible: column._column.visible,
|
|
width: column._column.width,
|
|
widthFixed: column._column.widthFixed,
|
|
widthStyled: column._column.widthStyled
|
|
};
|
|
this.send({
|
|
ui_control:{callback:'columnResized',columnWidths:newColumn}
|
|
});
|
|
}
|
|
```
|
|
- use `this.send({})` to pass result to Node-RED. (to avoid a loopback add`ui_control.callback="someText"`)
|
|
```javascript
|
|
this.send({topic: "anyTopic",payload:"anyPayload",ui_control: {callback:"myCallback"}});
|
|
```
|
|
- all parameters are named according to tabulator documentation. Use ```field``` instead of ```Property``` used in node configuration
|
|
- no validation of `msg.ui_control` data is performed! So if you don`t get the results you expect take a look on your browsers console.
|